The DAX function ALLSELECTED is a powerful function that accomplishes something that cannot be done otherwise. The simple version of what ALLSELECTED does, is this: like other ALL functions, it removes filters from the evaluation context of a calculation. ALLSELECTED behaves in a special way, however: it can distinguish between filters created within a visual itself and filters originating from other report elements. The most common use is to use ALLSELECTED to compute the total of everything that is included in a visual. For example:
Sales AllSelected =
CALCULATE(
[Sales],
ALLSELECTED(‘Product’)
)
The measure [Sales AllSelected] returns the total sales for all products, but keeps filters from outside the visual, like from a slicer:

This measure is not very valuable in itself, obviously, but the calculation can be used to compute a relative percentage of sales versus everything that is shown in the visual:
Relative Product Sales =
VAR AllSales =
CALCULATE(
[Sales],
ALLSELECTED(‘Product'[Product])
)
RETURN
DIVIDE([Sales], AllSales)
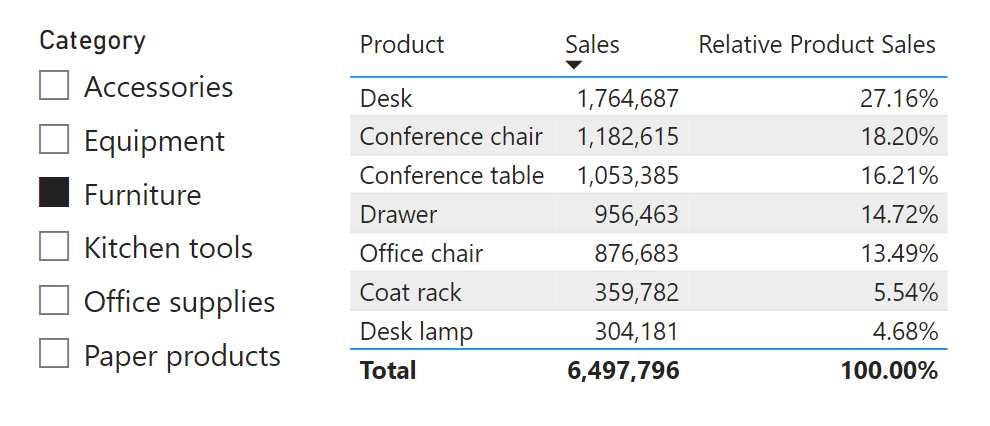
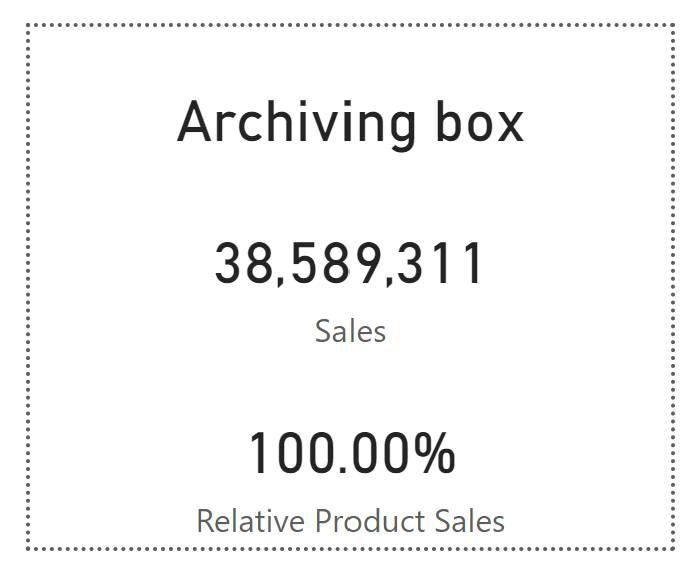
With this measure, percentages are computed that always add up to 100% in this visual:
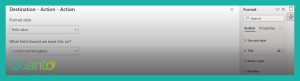
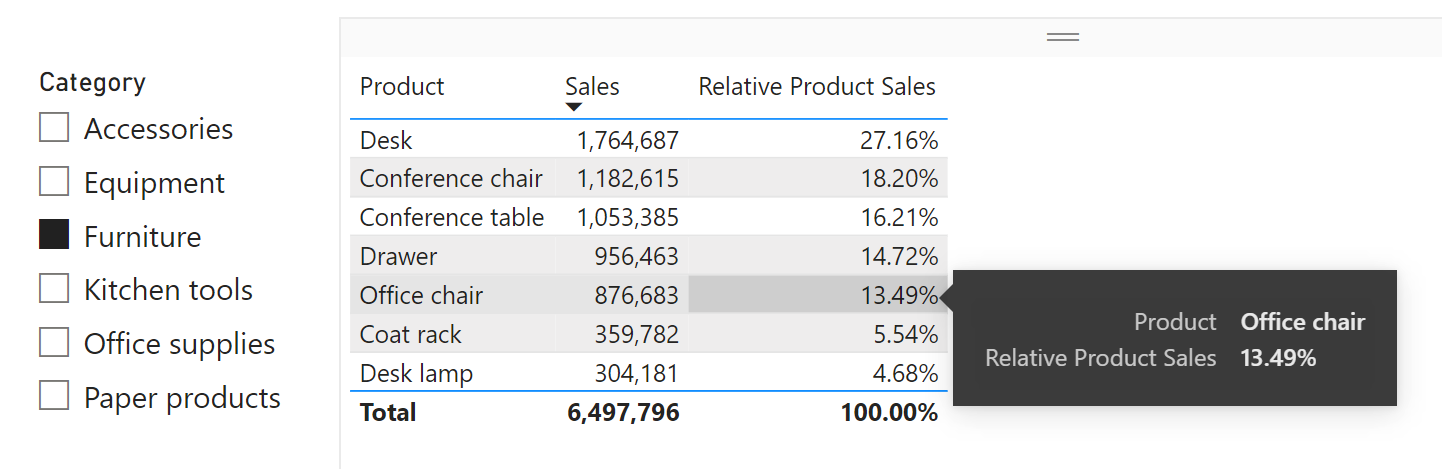
Now, suppose you want to add tooltips to this visual. (I know, tooltips on a table visual are not the most useful things but you can, of course, do this with charts as well.) The default tooltip works just fine:
But as these black boxes are rather boring, you decide to create a custom report page tooltip instead. In the example below, we have just three card visuals with the product name, the Sales, and the Relative Product Sales:
After setting the tooltip property of the table visual to this tooltip, the result is what is shown below:
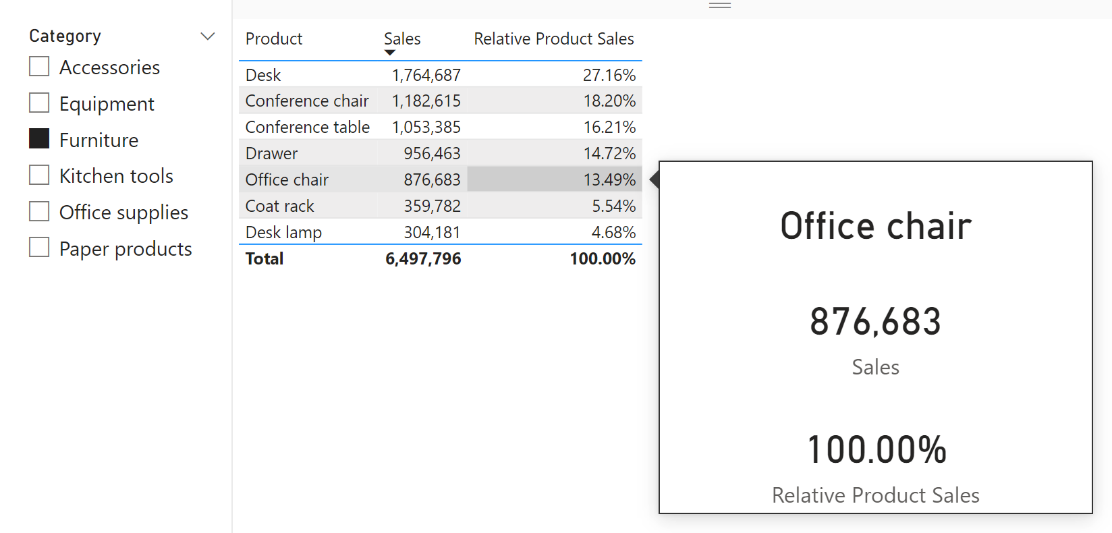
Clearly, something is wrong here! While the product name and sales are correctly shown, the relative product sales is 100% now. What has happened?
The cause of this problem is ALLSELECTED. In the context for the Office chair sales calculation, two filters are active: one on product category (selecting the Furniture category) and one on product (selecting Office chair). ALLSELECTED removes the filter from product, as this filter is created within the visual, leaving only the category filter. The result is the total sales in the Furniture category.
A report page tooltip works by adding all filters in the visual that uses the tooltip, to the tooltip page. But this means that none of these filters originate from a visual on the tooltip page! And therefore, ALLSELECTED does not remove anything. The Relative Product Sales measure thus returns the percentage of product sales versus the sales of the same product, which is obviously 100%.
The way to solve this problem is not to use ALLSELECTED here but to find another way to change the context in such a way that all items in the visual are selected. In the example above, an alternative formula could be used:
Relative Product Sales 2 =
VAR RelativeSales =
CALCULATE(
[Sales],
ALL(‘Product'[Category])
)
RETURN
DIVIDE([Sales], RelativeSales)
This will correctly render the tooltip results:
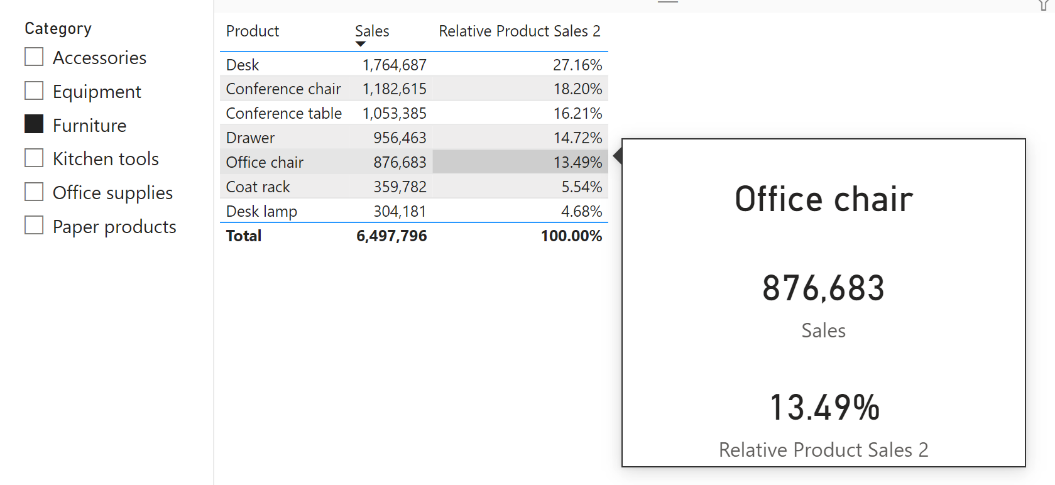
There are some disadvantages to this approach, of course. The alternative formula may not work when used in other visual configurations, and you may need to write multiple alternatives for different reports or report pages. Another limitation is that the example only works because the Category field is not in the visual itself. If it was, chances are that the new measure would return incorrect results. Which cannot be solved, really, as it would depend on being able to distinguish between two filters on the very same column.
So, be careful when using ALLSELECTED in combination with fancy report page tooltips!