There are many ways to create a dynamic report in Power BI. A lot of the visuals that are available in Power BI also have a conditional formatting possibility to help you create dynamic visuals, which is indicated with the little icon: ![]()
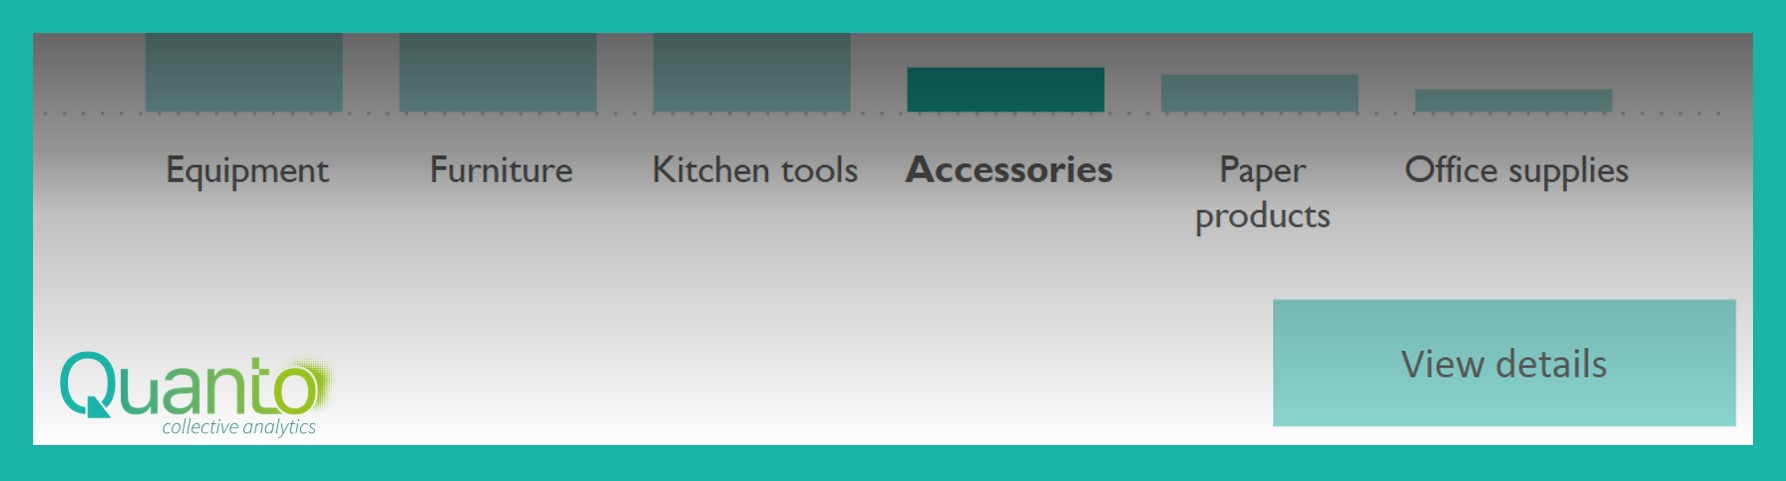
This blogs shows you how to create a dynamic drill through. With only one button, it is possible to navigate to different details pages, depending on which item the user has selected to drill through to. This is depicted in the video below, where the user ends up on different detail pages for the different categories that can be selected for the drill through.

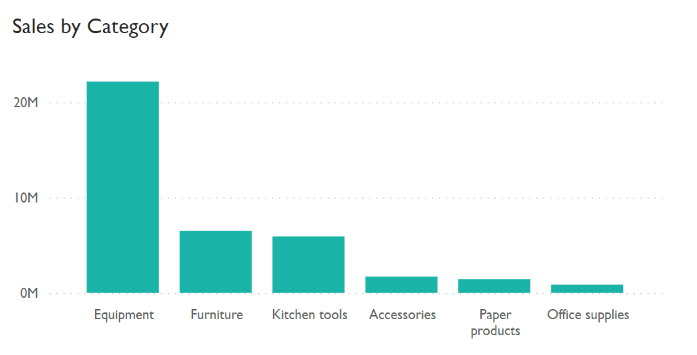
Let’s build this step-by-step. We start with a visual where you show the data per some category, like the Sales per Product Category that we have in the example, in a clustered column chart:
To investigate more about this data, you want to create a detail page, where you can drill through to more specific data for each category. However, it may be the case that it is far more useful to look at the details for the Category of Equipment in a completely different format than for the Category of Accessories. For example, maybe it makes sense to view the sales for equipment per supplier, while for the accessories it makes much more sense to view sales per customer. This means that you might want to create three different detail pages: one for the details of Equipment, one for the details of Accessories, and one general detail page for the other categories. But you want to navigate to these detail pages with only one button, so that the user does not have to make a choice to which detail page he wants to navigate.
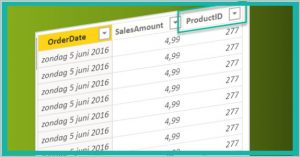
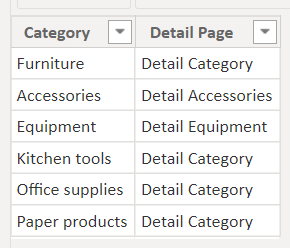
Luckily, this is possible! And to do so, we only have to create one table and a measure. The table is needed to specify the conditions you want to have for the button: in this example, we need to have a column that specifies the detail page for each category. It will look like this:
Please think about how you want to set up the visual which will allow the user to select the Category before drilling through (in our example case, the clustered column chart with Sales by Category): if you put the regular Category from the Product table on the axis of the visual, you may want to use a double filtering direction in the relationship between the existing Product table and this new table:
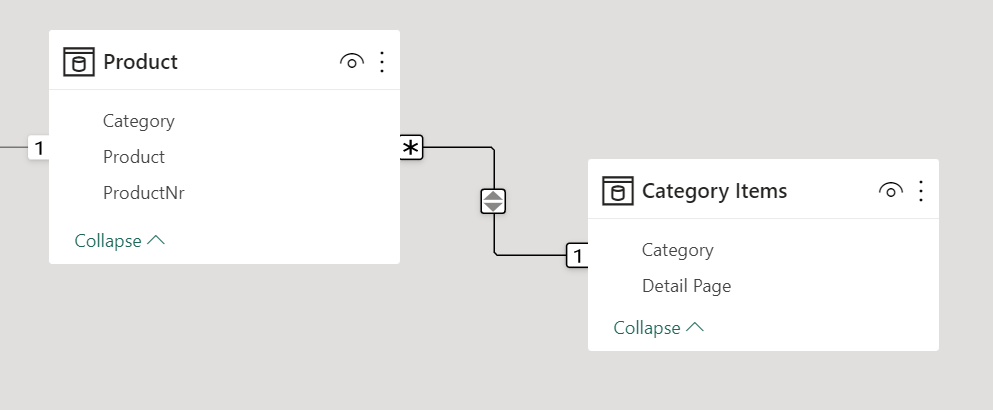
If you use the Category column from the new table on the axis of the visual (and consequently also on the drill through pages as the drill through field), you don’t need to have the double filtering direction in the relationship.
The second thing you need, is a measure that gives you the name of the detail page that you want to drill through to. This can be an easy measure with the use of the DAX function SELECTEDVALUE:
Category Details = SELECTEDVALUE(‘Category Items'[Detail Page])
Now you’re almost ready to go! Of course you still have to create the drill through pages (think about which column to use as the drill through field here), and a button that allows the user to drill through to the detail pages. For the detail pages, make sure you name the pages exactly the same as you did in the newly created column Detail Page. Otherwise, it will not work. Another best practice is to hide the drill through pages, so your user can only reach it by using the buttons (and so drilling through on the correct column of the data).
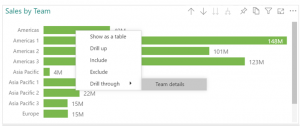
When you create the button, you can now use the Action Type Drill through, with a conditional Destination where you use the measure that you just created:
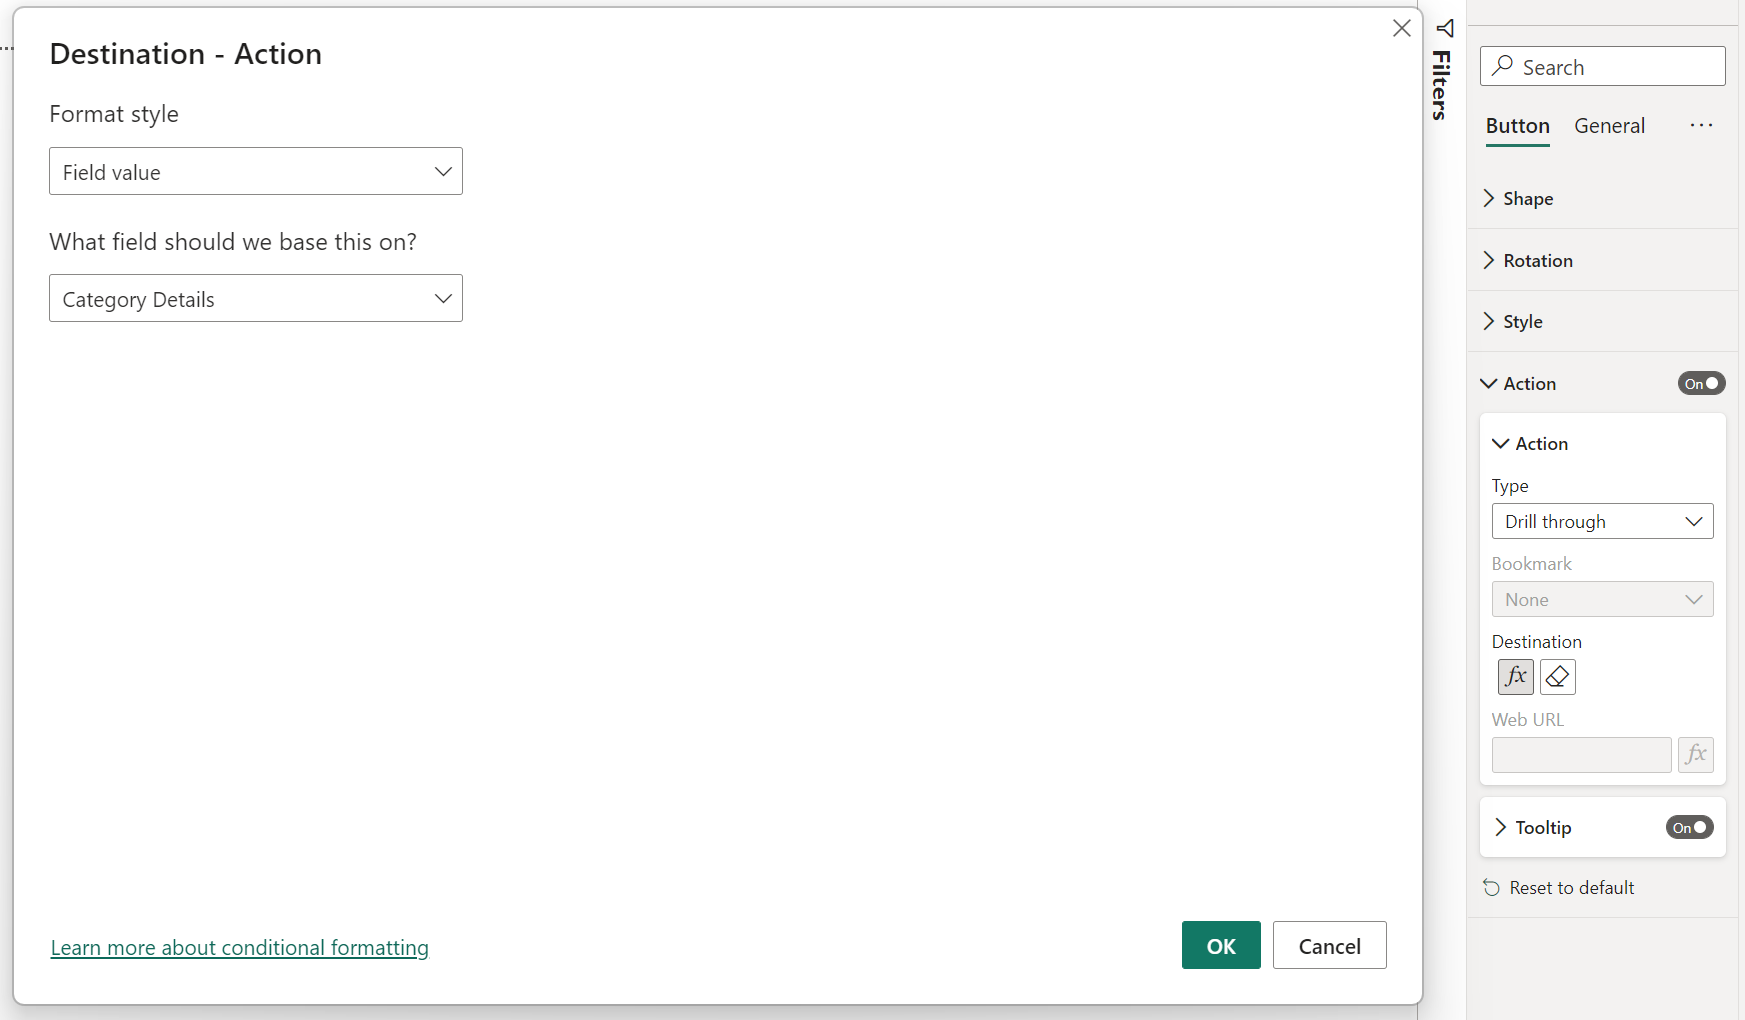
Now the button will navigate you to different detail pages, depending on which Category is selected for the drill through, thereby creating a dynamic drill through with only one button. How great is that! Hopefully this is something that you can use in your next report.