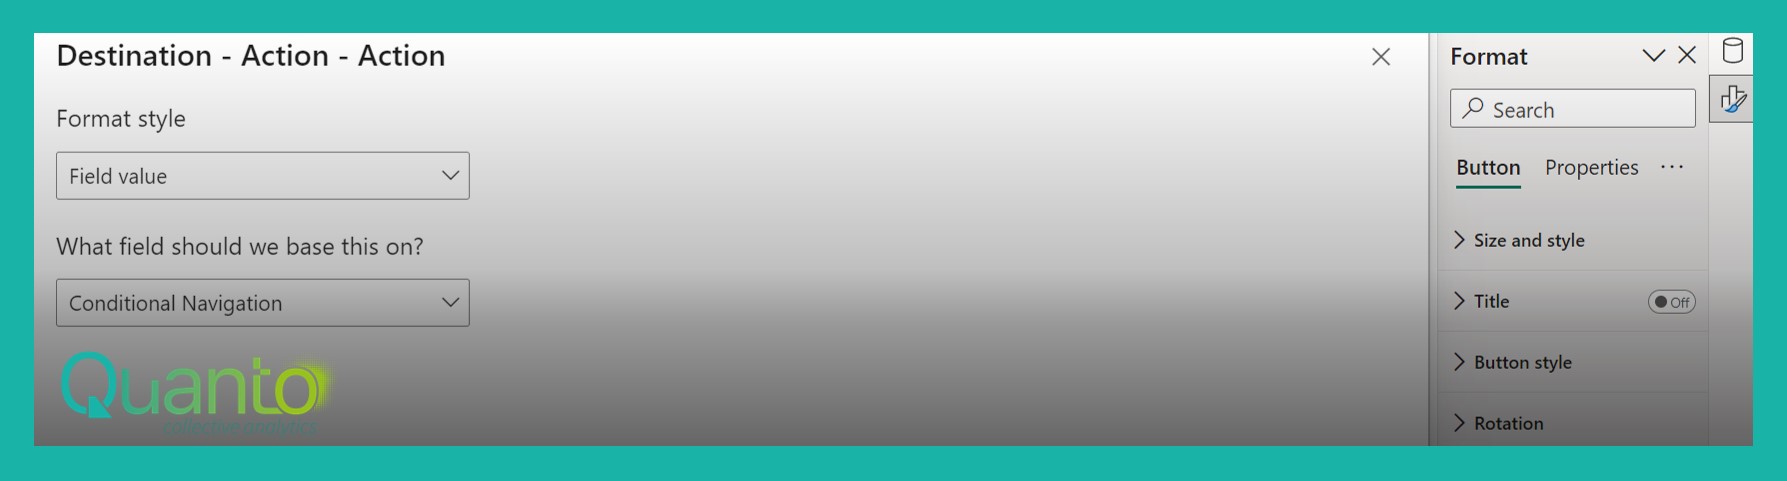
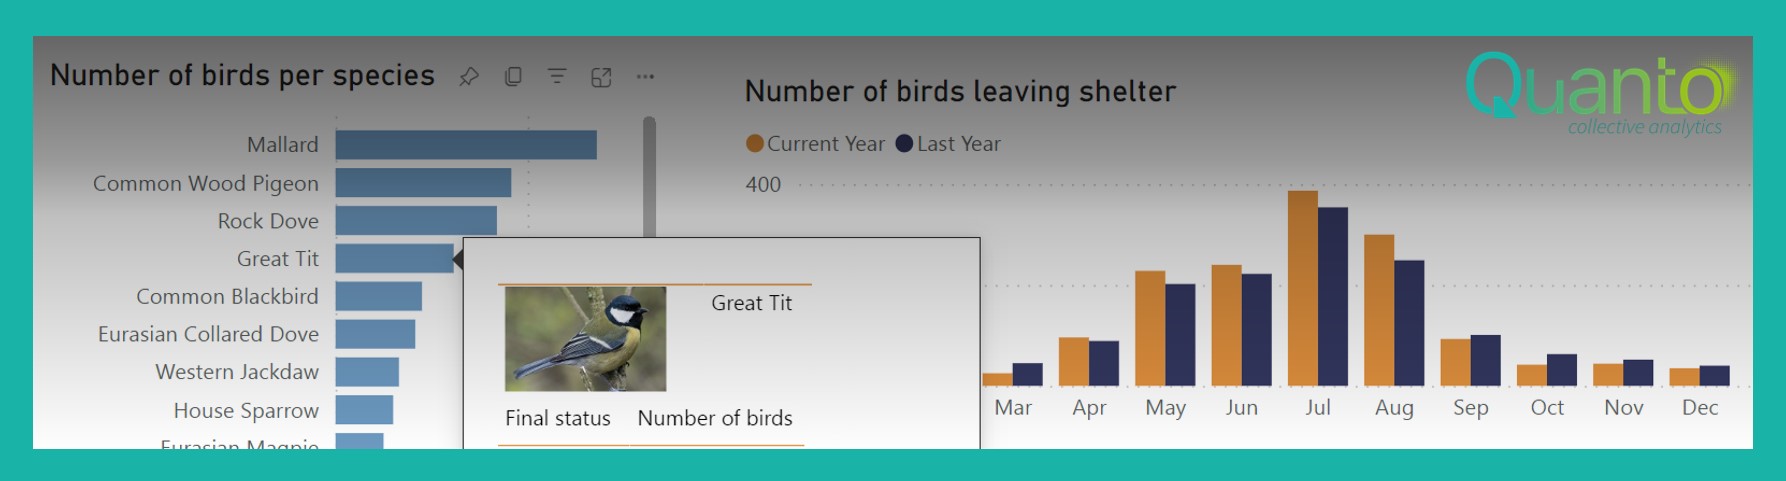
Dynamic buttons in Power BI (1)
There are many ways to create a dynamic report in Power BI. A lot of the visuals that are available in Power BI also have a conditional formatting possibility to…
When analyzing large amounts of data, we are often interested in trends and correlations. One of the most basic methods to research these, is linear regression. Linear regression is a…
The DAX function ALLSELECTED is a powerful function that accomplishes something that cannot be done otherwise. The simple version of what ALLSELECTED does, is this: like other ALL functions,…
This article is a follow-up to the AutoExists introductory post and one with an example on time intelligence based on workdays. In the latter, we created the month-to-date chart below,…
I recently delivered a training about data awareness. Strangely enough data awareness is not a common practice within organizations. To my great surprise the impact of data on their business…
In this post, I show an approach to non-standard time intelligence analysis. This is, in fact, the second article on AutoExist. In the first, I explained the general principle of…
Working with dates in Power Query. How to set up a monthly series.
When working with DAX measures, it is critical to think in terms of context. Those of you who have taken our course of DAX Fundamentals, or attended one of our…
One of the foundational features of Power BI visual reports is interactivity. The capability to interact with the report allows for primarily visual representation of insights, while at the same…
We, at Quanto, always look at Power BI with a big grin on our face. We love this stuff. And, since we are working with it for more than a…